Introduction and Recap
Now that your environment is ready, let’s deploy CIS benchmarks to your Windows servers and learn how to scale from one to hundreds of instances. If you’re like me, you probably tested that MOF file we created in Part 1 on your test instance and watched 300+ security settings magically apply themselves. Pretty satisfying, right? But the real power comes when we can do this across our entire fleet without touching a single RDP session.
Quick Recap from Our Journey So Far
In Part 1, we:
- Set up IAM roles and S3 buckets to store our configurations
- Installed the CisDsc module and explored what it can do
- Created our first DSC configuration targeting CIS Level 1
- Uploaded that MOF file to S3 (remember
localhost.mof?) - Understood how Systems Manager, DSC, and S3 work together
In Part 2 (you did read that, right?), we:
- Verified Systems Manager can actually see and manage our instances
- Tested network connectivity to AWS endpoints
- Ensured SSM Agent is running and registered
- Ran test commands to confirm everything works
If you skipped Part 2 and your instances aren’t showing up in Systems Manager Fleet Manager with an “Online” status, stop here and go back. Seriously. The rest of this won’t work without that foundation.
What You’ll Learn Today
Today we’re going operational. You’ll learn how to:
- Deploy configurations using Systems Manager State Manager
- Monitor compliance in real-time (and actually understand what failed)
- Scale your deployment strategy without melting your servers
- Optimize for performance and cost (because cloud bills are real)
Fair warning: we’re going to hit some bumps. DSC is powerful but quirky, and Systems Manager adds its own personality to the mix. I’ll share the gotchas I’ve discovered through trial and error (emphasis on error).
Pre-flight Check
Before we dive in, let’s make sure you’re ready. If you’re using the AWS Console, navigate to Systems Manager > Node Tools > Fleet Manager to verify your instances show as “Online”.
From your local machine, you can also run this quick check:
You should see:
- Your instance ID
- PingStatus: Online
- A version number for the agent
If you see “Connection Lost” or nothing at all, go back to Part 2. Don’t worry, we’ll wait.
Creating Production-Ready DSC Configurations
Let’s level up from our basic configuration. Production environments need logging, error handling, and flexibility.
Complex DSC Configuration with Logging
First, let’s create a more robust configuration that actually tells us what it’s doing. Also, not all servers are created equal. Your domain controllers have different security requirements than your web servers. Finally, CIS benchmarks aren’t enough, oftentimes you need something additional. Here’s a configuration that applies logging for cloudwatch, different server roles, and modifies the registry direct.
| |
Notice the ConfigurationMode = 'ApplyAndMonitor'? That’s intentional. In production, you often want to detect drift without automatically fixing it, especially during business hours. We’ll handle auto-remediation through Systems Manager scheduling.
Finally, add a MOF that’s lightweight to test your logic before actually throwing a big configuration at things. Save this as test-lightweight.mof in the same .\MOF folder you put the others.
/*
@TargetNode='localhost'
@GeneratedBy=TestUser
@GenerationDate=01/01/2024 12:00:00
@GenerationHost=TestHost
*/

instance of MSFT_RoleResource as $MSFT_RoleResource1ref
{
ResourceID = "[WindowsFeature]TelnetClient";
Ensure = "Absent";
Name = "Telnet-Client";
ModuleName = "PSDesiredStateConfiguration";
ModuleVersion = "1.0";
ConfigurationName = "TestLightweightConfiguration";
};

instance of MSFT_RegistryResource as $MSFT_RegistryResource1ref
{
ResourceID = "[Registry]TestRegKey";
ValueName = "DSCTestValue";
ValueType = "String";
Key = "HKEY_LOCAL_MACHINE\\SOFTWARE\\DSCTest";
ValueData = {"TestConfiguration"};
Ensure = "Present";
ModuleName = "PSDesiredStateConfiguration";
ModuleVersion = "1.0";
ConfigurationName = "TestLightweightConfiguration";
};

instance of MSFT_ServiceResource as $MSFT_ServiceResource1ref
{
ResourceID = "[Service]Spooler";
Name = "Spooler";
State = "Running";
StartupType = "Automatic";
ModuleName = "PSDesiredStateConfiguration";
ModuleVersion = "1.0";
ConfigurationName = "TestLightweightConfiguration";
};

instance of OMI_ConfigurationDocument
{
Version="2.0.0";
MinimumCompatibleVersion = "1.0.0";
CompatibleVersionAdditionalProperties= {"Omi_BaseResource:ConfigurationName"};
Author="TestUser";
GenerationDate="01/01/2024 12:00:00";
GenerationHost="TestHost";
Name="TestLightweightConfiguration";
};
Upload these new MOFs to S3:
| |
Deploying via AWS Systems Manager
Now for the fun part - actually deploying these configurations at scale. But first, let’s verify Systems Manager can execute commands on your instance:
| |
If that doesn’t work, you know what I’m going to say… Part 2 is calling your name.
Creating the Systems Manager Document
First, we need a Systems Manager document that knows how to apply our DSC configurations. There is a pre-made AWS-ApplyDSCMofs that you can use out of the box, but I tweaked it a bit:
| |
Save this as DSC-Apply-Configuration.json and create the document:
Creating State Manager Association
Now let’s create associations that automatically apply our configurations. In the console, you can do this via Systems Manager > Node Tools > State Manager > Create association.
Throw a name in there if you’d like and then search for the document you just uploaded. We’re going to use the test-lightweight.mof as our guinea pig first and run it once.
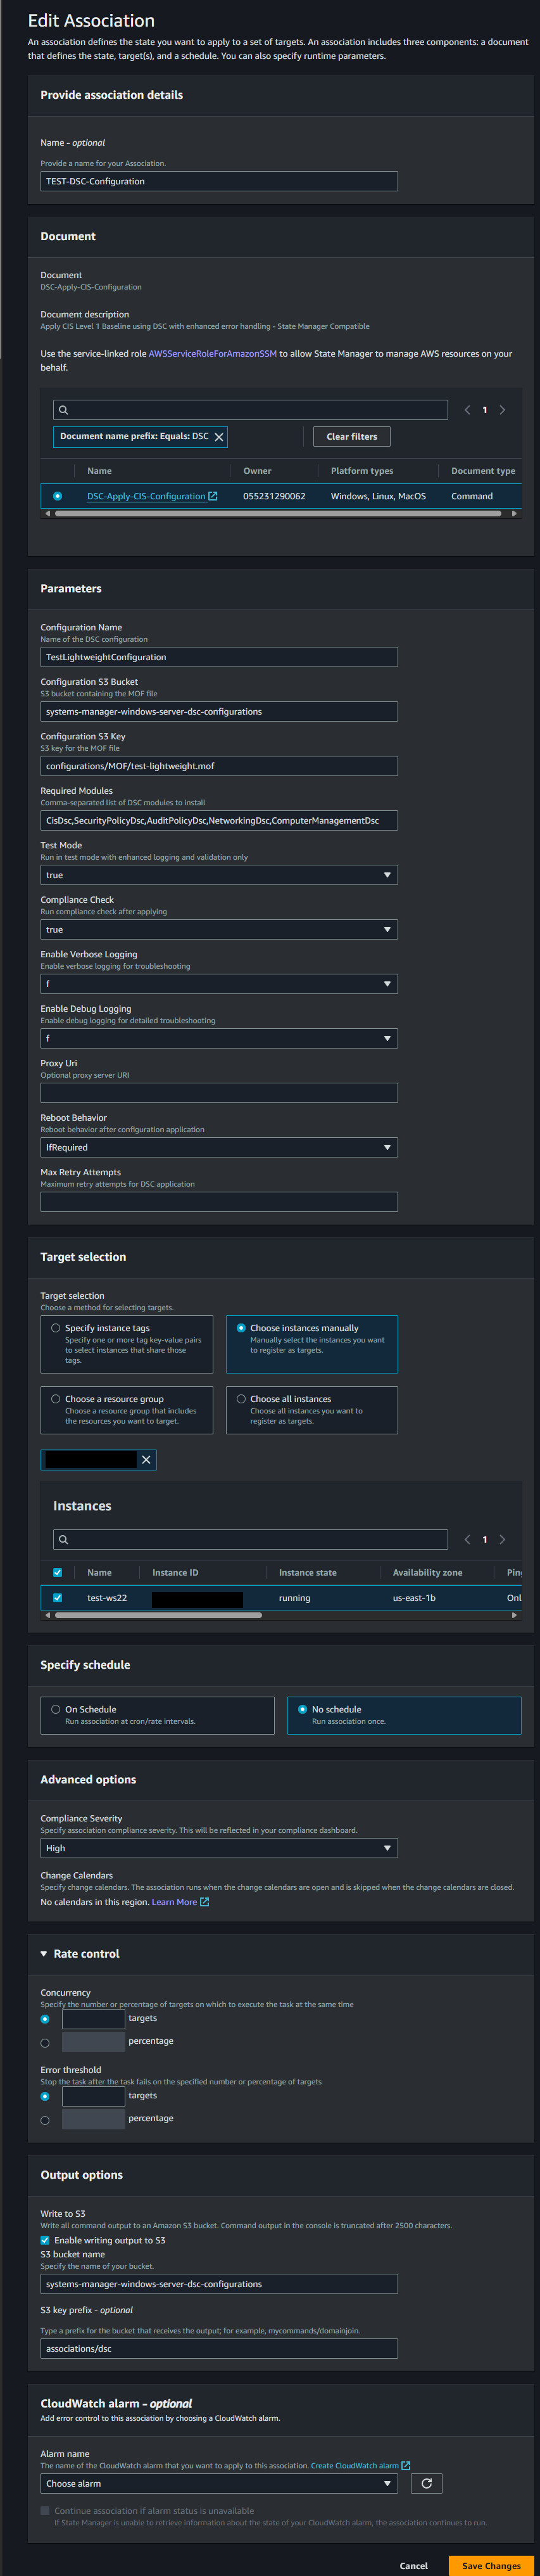
Or the same information via CLI:
| |
You will be redirected to the Association’s page and see it is in a grey Pending state.

Wait a couple minutes and it should change to a green Success on refresh. Once it’s green, click on it and go the Execution History and you should see a success as well.

You can drill down to the output, maybe seeing it install some other DSC modules that we haven’t covered yet. We also send it to the S3 bucket we’ve been using for MOFs, so you can check there as well but note the GUID there is your Run Command ID, not your Execution History ID.
If you look at the registry or settings nothing was changed. Why? Because we set the test mode = true flag, let’s modify the association again and change that value.
You can just edit via console or send another cli.
After the update we once again we wait for Systems Manager to reach out to our instance and apply the configurations. Once it shows Success, let’s RDP and check the registry, you should see a HKEY_LOCAL_MACHINE\SOFTWARE\DSCTest folder with a DSCTestValue set to TestConfiguration now. You can also check the telnet and print spooler settings to verify as well.
Deployment Strategies
Now that you’ve successfully deployed to a single test instance, let’s talk about scaling up safely. The jump from one server to many is where things get interesting (and potentially dangerous).
Start with Tags
The key to safe deployments is using EC2 tags to control your rollout. If you haven’t already when we made the template, tag your instances based on their role and environment:
| |
The Safe Scaling Approach
Here’s how to go from one server to many without breaking everything:
1. Expand to Your Test Environment
First, deploy to all test servers you just tagged to catch any server-specific issues:
| |
Key settings explained:
max-concurrency "2"- Only 2 servers at a timemax-errors "1"- Stop if any server failsschedule-expression "rate(12 hours)"- Re-apply twice daily
2. Production Canary Deployment
Pick 1-2 production servers as your “canaries” - these brave servers get changes first:
| |
Monitor for 24-48 hours before proceeding. Check:
- Performance metrics (CPU, memory)
- Event logs for errors
- Application functionality
- User complaints
3. Gradual Production Rollout
If your canaries survive, gradually increase the deployment scope:
| |
Understanding Concurrency Settings
- Percentage:
"10%"- Deploys to 10% of targeted instances at once - Fixed number:
"20"- Deploys to exactly 20 instances at once - Which to use: Percentages for small fleets, fixed numbers for large fleets (you don’t want 10% of 1000 servers = 100 simultaneous deployments)
Quick Rollback Plan
If something goes wrong, here’s your emergency brake:
| |
Deployment Checklist
Before each phase:
- [ ] Review compliance reports from previous phase
- [ ] Check performance metrics
- [ ] Verify no critical alerts fired
- [ ] Confirm rollback plan is ready
- [ ] Document any new exclusions needed
For now, this manual phased approach works well for fleets up to a few hundred servers. In Part 4, we’ll automate this entire process with PowerShell functions that handle the monitoring and phase progression automatically.
Monitoring and Compliance
Deploying is only half the battle. You might have been wondering how you’re supposed to check for metrics. Now we need visibility into what’s actually happening.
Real-time Compliance Monitoring
In the console, you can view compliance data under Systems Manager > Node Tools > Compliance.
Or if you’re like me and prefer scripts, let’s build a compliance report using PowerShell.
| |
Creating CloudWatch Dashboard
Let’s create a basic dashboard to visualize compliance:
| |
Save the above as dashboard.json and then we’ll create the dashboard:
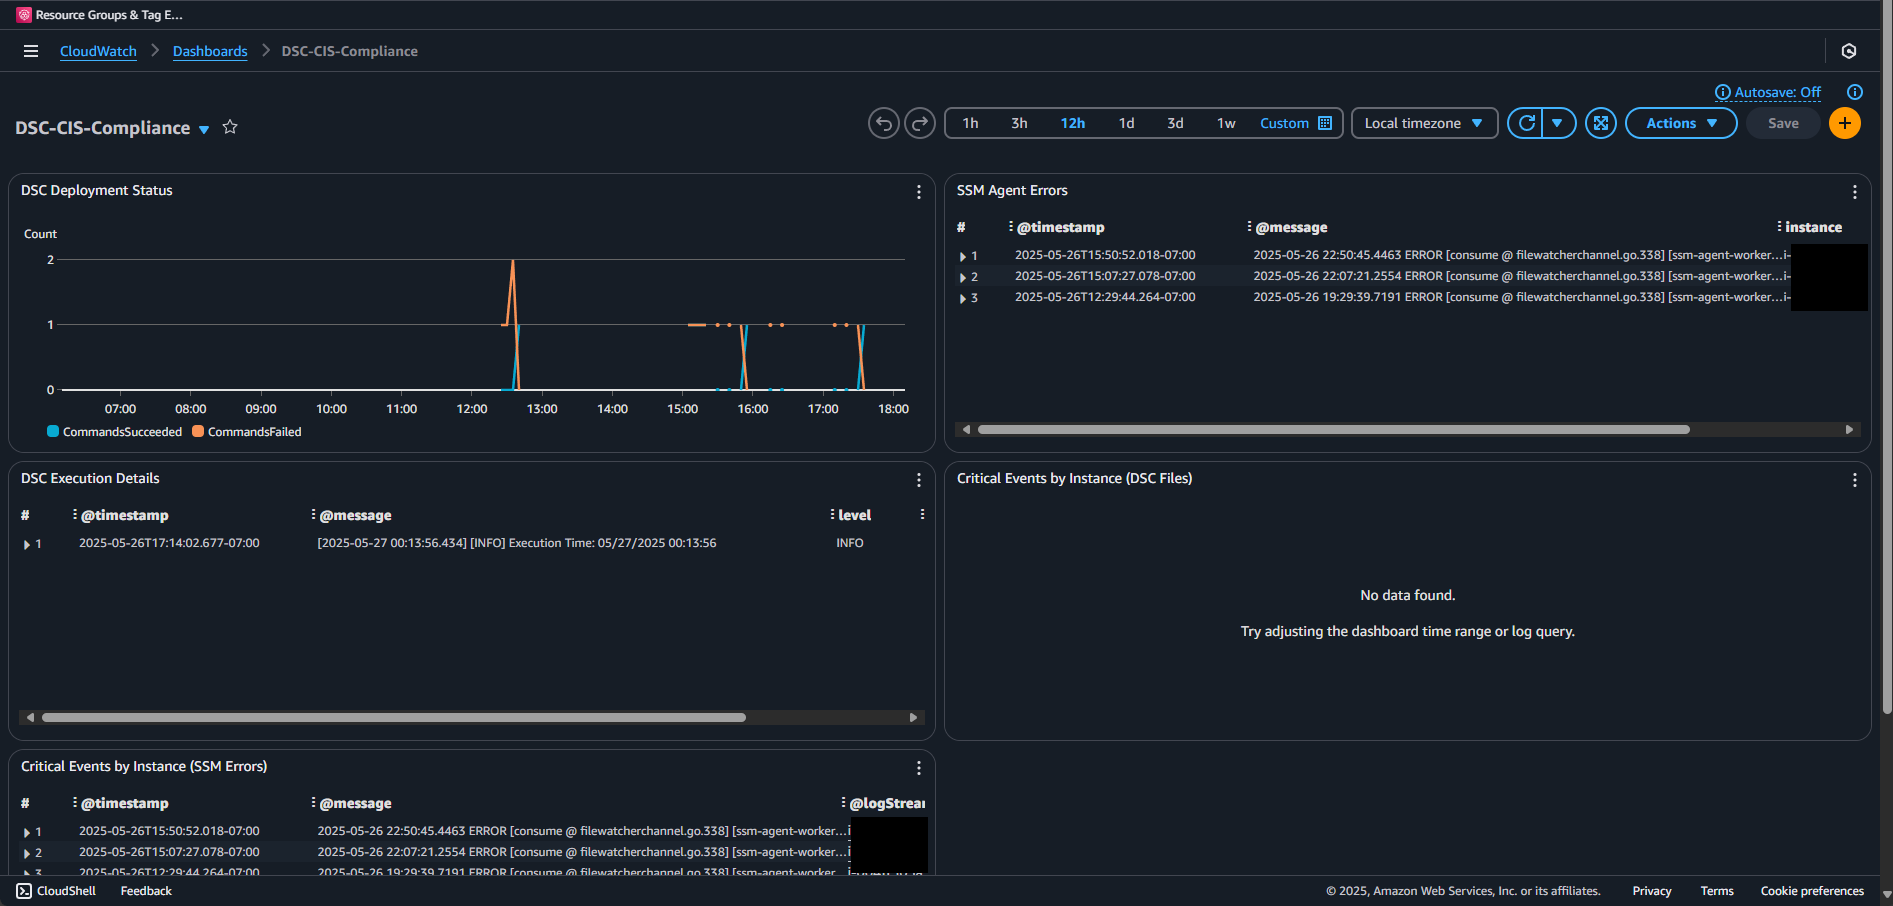
Setting Up Alerts
Don’t wait for someone to check the dashboard - get notified when things go wrong:
| |
The metric filters will watch your log files and count:
- How many times DSC starts (total executions)
- How many times DSC completes successfully
- How many ERROR messages appear
Then your alarms can use these counts to alert you when things go wrong.
What Gets Created (Once for Your Entire AWS Account):
- SNS Topic - One topic that receives alerts from all servers
- Log Metric Filters - These watch the CloudWatch log groups that ALL your servers write to
- CloudWatch Alarms - These monitor metrics across ALL servers
How It Works:
┌─────────────────┐    ┌─────────────────┐    ┌─────────────────┐
│   Server 1      │    │   Server 2      │    │   Server 3      │
│   (Web Server)  │    │   (Domain Ctrl) │    │   (Member Srv)  │
└─────────────────┘    └─────────────────┘    └─────────────────┘
         │                       │                       │
         └───────────────────────┼───────────────────────┘
                                 │
                                 ▼
                    ┌─────────────────────────┐
                    │  CloudWatch Log Groups  │
                    │  - /aws/systemsmanager/ │
                    │    dsc-files            │
                    │  - /aws/systemsmanager/ │
                    │    ssm-errors           │
                    └─────────────────────────┘
                                 │
                                 ▼
                    ┌─────────────────────────┐
                    │   Metric Filters        │ ← Created ONCE
                    │   (Count errors/success)│
                    └─────────────────────────┘
                                 │
                                 ▼
                    ┌─────────────────────────┐
                    │   CloudWatch Alarms     │ ← Created ONCE
                    │   (Alert on thresholds) │
                    └─────────────────────────┘
                                 │
                                 ▼
                    ┌─────────────────────────┐
                    │      SNS Topic          │ ← Created ONCE
                    │   (Email notifications) │
                    └─────────────────────────┘
Custom Metrics for Deep Insights
For more detailed monitoring, push custom metrics:
| |
Step-by-Step Breakdown
Step 1: You run this ONCE from your computer
- Creates the PowerShell script as a variable
- Sends it to AWS Systems Manager
- Sets up an hourly schedule
Step 2: Systems Manager takes over
- Looks for all VMs with the tag
Environment=test - Automatically runs the script on each VM every hour
- Each VM executes the compliance check independently
Step 3: Each VM does the work
- Runs
Test-DscConfiguration -Detailedon itself - Calculates its own compliance percentage
- Sends its own metrics to CloudWatch
You can verify the output of this script with the Maintenance Windows: mw- that is shown and correlating with Maintenance Windows in the console.
Scaling Challenges and Solutions
As you scale beyond a handful of servers, new challenges emerge. Let’s tackle them head-on.
Performance Impact Analysis
DSC can be CPU-intensive, especially during initial configuration. Here’s how to measure and manage the impact:
| |
This will crawl what tag you specify and return a brief window of usage in a companion json. Useful to send out while you are dialing in your configurations to see if you need to split things up – whether it’s splitting up total number of benchmarks or adjusting hours on the server’s workload.
Handling Scale Limits
AWS has rate limits, and DSC has resource limits. Here’s how to handle both:
| |
Optimizing MOF File Distribution
S3 is great, but at scale you need to optimize data transfer. This takes a bit of prep.
| |
| |
| |
New ssm-document-cached-dsc.json that we’ll be uploading. note: I kind of got in the groove of adding unicode outputs and that messed this up so bad lol
| |
And finally run New-SSMCacheDocument.ps1 to get it up and ready for your association.
| |
Next Steps and Preview
What We’ve Accomplished
Look at what you’ve built! You’ve gone from manual server hardening to a fully automated, scalable solution that:
- Deploys production-ready DSC configurations with proper error handling and logging
- Scales intelligently from one server to thousands without overwhelming your infrastructure
- Monitors compliance in real-time with CloudWatch dashboards and alerts
- Reduce Redundant Downloads through caching
You’re no longer just applying security settings - you’re running a compliance platform.
Key Takeaways
Before you rush off to implement this everywhere, remember these lessons:
- Verify Systems Manager connectivity first - I cannot stress this enough. If you skipped Part 2, issues will haunt you throughout deployment.
- Start small, scale gradually - Test on a few non-critical servers first. I learned this the hard way when I accidentally locked myself out of 50 servers (thank goodness for break-glass accounts).
- Monitor performance impact closely - DSC can be CPU-intensive. Schedule wisely and watch those CloudWatch metrics.
- Automate compliance reporting - Your auditors will love you for those automated reports showing 99%+ compliance.
- Plan for exceptions and conflicts - Every environment has quirks. Document your ExcludeList choices.
- Test your recovery procedures - Before you need them. Trust me on this one.
Coming in Part 4: Advanced Operations
Ready to take it to the next level? In Part 4, we’ll cover:
- Handles real-world issues like timeouts, WinRM quotas, GPO conflicts, and Systems Manager connectivity
- Production best practices from organizations running this at scale
- Advanced automation with Lambda for self-healing infrastructure
- Multi-account strategies using AWS Organizations and Control Tower
- CI/CD integration to version control your security configurations
- Disaster recovery planning when (not if) something goes catastrophically wrong
Homework Before Part 4
Want to be ready for the advanced stuff? Here’s your homework:
- Deploy to at least 10 instances - You’ll start seeing patterns and issues that don’t appear with just one or two servers.
- Set up your CloudWatch dashboard - Visualize your compliance status. Make it pretty enough to show management.
- Document your exclusion list - For each excluded control, document why. Future you will thank present you.
- Measure baseline performance metrics - How long does a full configuration take? What’s the CPU impact? You’ll need these numbers for capacity planning.
- Break something and fix it - Seriously. Intentionally cause a configuration drift and watch your automation fix it. It’s oddly satisfying.
Resources and References
Here are the official docs you’ll want to bookmark:
- AWS Systems Manager State Manager documentation
- AWS Systems Manager prerequisites
- PowerShell DSC documentation
- CIS Benchmarks download page
- AWS Systems Manager pricing
- CloudWatch Logs pricing
- VPC endpoints for Systems Manager
Ready to Scale Your Security?
You’ve got the tools, the knowledge, and hopefully the motivation to transform your Windows security posture. The question isn’t whether you should automate your security configurations - it’s how quickly you can get started.
Share your deployment experiences in the comments:
- What issues did you hit that I didn’t cover?
- How many servers are you managing with this approach?
- What creative exclusions did you need for your environment?
And if you successfully deploy this to 100+ servers without any issues on your first try, please let me know your secret. I’ll either be incredibly impressed or incredibly suspicious. 😉
Majority of code listed in this article can also be viewed at the companion GitHub.
See you in Part 4 where we’ll push the boundaries of what’s possible with DSC and Systems Manager!